
Electrophysiology of Heart
Electrophysiology of the Heart: Understand how your heart beats! This blog post explains the electrophysiology of the heart, a crucial aspect of human physiology, in an easy-to-understand way. cardiac electrophysiology is essential for anyone studying CVS pharmacology, I hope you enjoy this blog post!
Alok Bains
2/11/20256 min read
Electrophysiology of Heart
Electrophysiology of Heart: “The electrophysiology of the heart refers to the electrical processes that regulate the heart's rhythmic contractions.” The human heart has an electrical system that controls the timing of heartbeats to pump blood effectively. The heart’s electrical system involves a series of electrical impulses (Action potential) that pass through specialised cardiac tissues, leading to synchronised heart muscle contraction.
Action potential: The action potential in the heart is an electrical signal that initiates a heartbeat. It develops due to rapid and temporary changes in electrical voltage across the cardiac muscle cell membrane. These electrical voltage changes are triggered by the ions like sodium, potassium and calcium moving across the cell membrane. This leads to heart muscle contraction and blood pumping.
The human heart electrophysiology can be studied under the below headings.
Cardiac Conduction System
Action Potential of Cardiac Cell
Pacemaker Cell Potential
Electrocardiogram (ECG) and Electrical Activity
Autonomic Regulation of Electrophysiology
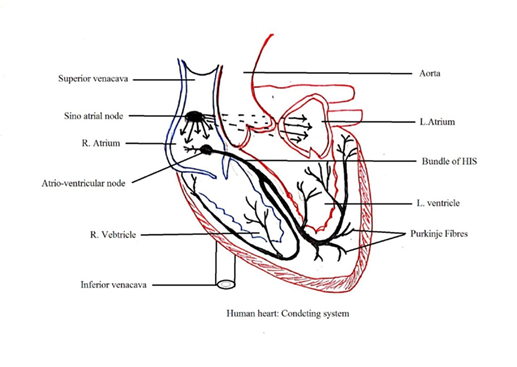
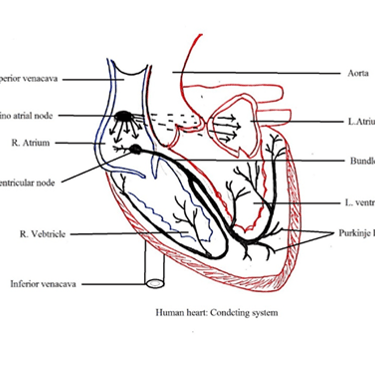
1. CARDIAC CONDUCTION SYSTEM: The human heart has three types of cardiac tissues (myocardium).
a. Atrial myocardial contractile tissues: Present in the atria wall.
b. Ventricular myocardial contractile tissues: Present in the ventricular wall.
c. Specialized myocardial tissue (myogenic muscles).
The specialised myocardial tissues (Specialized cardiac tissues or myogenic muscles) generate electrochemical waves (Action potential) without external nervous stimulation. They form a cardiac conduction system in the heart wall with two nodes: sinoatrial nodes (SA Nodes) and atrioventricular nodes (AV nodes).
i. The sinoatrial node (Heart’s natural Pacemaker). SA Node has flat myogenic muscles in the right atrium superior lateral wall below the superior venacava opening. It generates spontaneous electrical impulses about 60-100 beats per minute under normal conditions. That determines heart rate. Fibres arise from the SA Node encircle the right and left atrium to pass electric impulses to the right and left atrium walls. Three internodal pathways arise from SA nodes as bundles of conducting fibres. These internodal pathways conduct impulses from the SA node to the atrioventricular node (AV node).
SA node controls contraction and relaxation of atria. It cannot control the contraction and relaxation of the ventricle due to the non-continuity of cardiac muscles between the ventricle wall (Ventricular myocardial contractile tissues) and the atria wall (Atrial myocardial contractile tissues).
ii. The atrioventricular node (AV node): The AV node in the right atrium septum wall near the coronary sinus opening stimulates passing electric impulses from the SA node to the ventricle wall through a bundle of HIS (AV bundles).
The AV node delays the impulse for a fraction of a second (about 100 milliseconds), which allows the atria to contract and empty their contents into the ventricles before the ventricles contract. AV node also amplifies impulses received from the SA Node. This increases the force of contraction of the ventricle.
iii. A Bundle of HIS: A bundle of HIS from the AV node passes through the atrioventricular septum and enters the interventricular septum. The Bundle of HIS forms the right and left branches.
iv. Purkinje fibres: Each branch from the Bundle of HIS produces various small branches that form a network of fine fibres (myocardial fibres) in the ventricle. These myocardial fibres are also called Purkinje fibres. Purkinje fibres cause the ventricles to contract and pump blood out to the body.
2. ACTION POTENTIAL OF CARDIAC CELL: 1. Cardiac electrophysiology is governed by the movement of sodium, potassium and calcium ions across the cardiac cell membrane. This produces rhythmic action potential (cardiac impulse or electric signal) and membrane potential.
Rhythmic action potential is divided into five phases. It starts from Phase 4 followed by Phase 0, Phase 1, phase 2, and Phase 3, and ends in Phase 4 to complete the rhythmic cycle of the action potential. Action potential in each phase is controlled by ion channels opening and closing.
Phases of the Cardiac Action Potential (Ventricular Myocytes)
a. Phase 4 (Baseline phase): It is the resting phase. The membrane remains highly permeable to potassium. At the resting phase, the potassium channel remains open; membrane potential is -90 mv. The sodium-potassium pump (Na⁺/K⁺ ATPase) maintains ionic balance at about -90 mV in ventricular cells.
b. Phase 0 (Rapid Depolarization): Rapid influx of Na⁺ (sodium) ions through voltage-gated sodium channels in the cell membrane. This leads to a sharp rise in membrane potential. It is a fast and steep depolarization of cells. That is rapid upstroke. Membrane potential reaches up to 30 mv. At the end of this stage, the sodium channel becomes inactive.
c. Phase 1 (Initial Partial Repolarization): Sodium channels close, and transient outward K⁺ (potassium) channels open for rapid outflow of potassium ions. This is potassium efflux causing a slight decrease in membrane potential.
d. Phase 2 (Plateau Phase): Opening the calcium ion channel causes the inward flow of calcium ions (calcium influx) through L-type calcium channels. This balances outward potassium movement (potassium efflux), maintaining a plateau crucial for sustained contraction.
e. Phase 3 (Repolarization): Calcium channels close, potassium ions efflux restores the resting membrane potential and membrane potential decreases to -90 mv. It ends in Phase 4 restarting rhythmic action potential.
3. PACEMAKER CELL ACTIVATION POTENTIAL (SA and AV Nodes): Pacemaker cells have an automatic, rhythmic action potential with distinct phases:
a. Phase 4 (Slow Depolarization): A slow inward Na⁺ current (funny current or If) gradually increases the membrane potential.
b. Phase 0 (Depolarization): L-type Ca²⁺ channels open, causing an influx of calcium and a gradual rise in potential.
c. Phase 3 (Repolarization): Potassium efflux restores the negative resting potential.
The absence of a stable resting potential allows pacemaker cells to generate rhythmic impulses autonomously.
Note: [The difference in charges across the cell membrane due to the unequal distribution of ions is called Membrane Potential. The rapid change in membrane potential due to ions flowing in and out of the cell is called Action Potential.
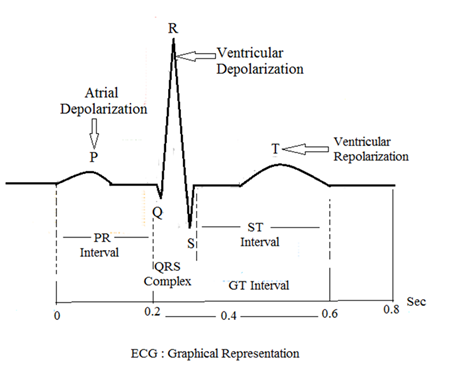
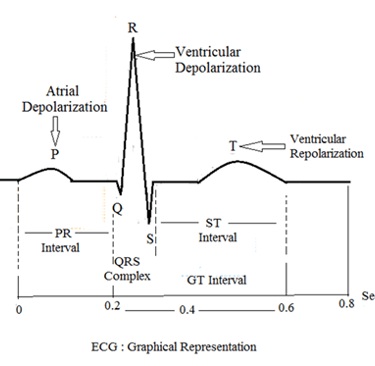
4. ELECTROCARDIOGRAM (ECG) & ELECTRICAL ACTIVITY: An ECG is a graphic record of electric current produced by cardiac muscle excitation. Cardiac muscle electrical excitation is due to cardiac impulses in the SA node, AV node, bundle of His, and Purkinje fibre. An ECG shows five waves, termed PQRST. PQRST does not stand for any particular word. It is not an abbreviation.
ECG consists of various lines. The straight, horizontal line of ECG is called the baseline or isopotential line:
a. P wave: P-wave is an upward wave above the baseline. It shows electrical excitation (atria depolarisation). It is due to SA node activation that leads to atria contraction. It shows the development of action potential (Electrical impulse).
b. R wave: The Q wave is followed by a large upright R wave. QR shows cardiac impulse transmission from the SA node to the AV node.
c. S wave: The R wave is followed by an S-downward wave. An S-downward wave represents ventricular contraction (ventricular depolarisation). RS shows cardiac impulse transmission from the AV node to the bundle of HIS to Purkinje fibre.
d. T wave: T-wave is a broad dome-shaped upward reflection. It shows ventricular relaxation (ventricular repolarisation).
The P, R, and T waves are considered positive waves as the T wave is upward from the baseline. The Q and S waves are considered negative waves as they are downward from the baseline.
ECG INTERVALS
ECG can be divided into three intervals
a) PR interval: Time from SA node impulse to ventricular activation. PR interval time is in between the beginning of the P wave and the beginning of QRS complex waves. The P wave is due to the electrical excitation of the atria. QRS complex waves are due to electrical excitation of the ventricle. Q is occasionally not found in ECG this is called PR interval, not QR interval.
b) QT interval: QT interval is the time between the beginning of Q waves and the end of T waves. The QT interval is also called the RT interval because occasionally Q is not found in ECG.
c) ST intervals: Time between the end of ventricular depolarization and the beginning of ventricular repolarization.
QRS complex: After the P wave, QRS waves begin within a fraction of a second. It starts with the Q wave i.e. a small downward deflection below the baseline. This PQ shows ventricular depolarization and contraction.
5. REGULATION OF CARDIAC ELECTROPHYSIOLOGY: The heart rate and conduction are influenced by the autonomic nervous system (ANS)
a. Sympathetic Stimulation (via norepinephrine/noradrenaline): Increases heart rate and conduction velocity by enhancing Na⁺ and Ca²⁺ currents.
b. Parasympathetic Stimulation (via acetylcholine): Slows heart rate by increasing K⁺ efflux and reducing Na⁺ and Ca²⁺ influx.
Conclusion: The heart’s electrical system ensures coordinated contraction for effective blood circulation. Understanding its electrophysiology is essential for diagnosing and managing cardiac diseases through interventions such as pacemakers and antiarrhythmic drugs.
Clinical Significance of ECG: Disruptions in cardiac electrophysiology can lead to heart diseases.
i. An increase in the length of PR interval indicates inflammation, Arteriosclerosis, infection in impulse fibres in atria or AV node
ii. An increase in QR interval length indicates myocardial infarction
iii. An increase in ST interval length indicates myocardial infarction or pericarditis.
iv. ST depression indicates myocardial ischemia (reduced blood flow to the heart).
v. Long QT Syndrome indicates prolonged repolarisation that increases the risk of sudden cardiac death.
vi. Flat T wave indicates insufficient oxygen supply to the heart
Pacemaker: The SA node is considered a natural pacemaker. An electrical device to normalize cardiac impulse generation is called an artificial pacemaker.
Alok Bains www/alokpdf.com